Creates a set of traceplots from the MCMC sample of an object of class 'JointAI'.
Usage
traceplot(object, ...)

# S3 method for class 'JointAI'
traceplot(object, start = NULL, end = NULL,
  thin = NULL, subset = c(analysis_main = TRUE), outcome = NULL,
  exclude_chains = NULL, nrow = NULL, ncol = NULL, use_ggplot = FALSE,
  warn = TRUE, mess = TRUE, ...)
Arguments
- object
object inheriting from class 'JointAI'
- ...
Arguments passed on to
graphics::matplotlty,lwd,lendvector of line types, widths, and end styles. The first element is for the first column, the second element for the second column, etc., even if lines are not plotted for all columns. Line types will be used cyclically until all plots are drawn.
colvector of colors. Colors are used cyclically.
cexvector of character expansion sizes, used cyclically. This works as a multiple of
par("cex").NULLis equivalent to1.0.bgvector of background (fill) colors for the open plot symbols given by
pch = 21:25as inpoints. The defaultNAcorresponds to the one of the underlying functionplot.xy.addlogical. If
TRUE, plots are added to current one, usingpointsandlines.verboselogical. If
TRUE, write one line of what is done.
- start
the first iteration of interest (see
window.mcmc)- end
the last iteration of interest (see
window.mcmc)- thin
thinning interval (integer; see
window.mcmc). For example,thin = 1(default) will keep the MCMC samples from all iterations;thin = 5would only keep every 5th iteration.- subset
subset of parameters/variables/nodes (columns in the MCMC sample). Follows the same principle as the argument
monitor_paramsin*_imp.- outcome
optional; vector identifying a subset of sub-models included in the output, either by specifying their indices (using the order used in the list of model formulas), or their names (LHS of the respective model formula as character string)
- exclude_chains
optional vector of the index numbers of chains that should be excluded
- nrow
optional; number of rows in the plot layout; automatically chosen if unspecified
- ncol
optional; number of columns in the plot layout; automatically chosen if unspecified
- use_ggplot
logical; Should ggplot be used instead of the base graphics?
- warn
logical; should warnings be given? Default is
TRUE.- mess
logical; should messages be given? Default is
TRUE.
See also
summary.JointAI,
*_imp,
densplot
The vignette
Parameter Selection
contains some examples how to specify the parameter subset.
Examples
# fit a JointAI model
mod <- lm_imp(y ~ C1 + C2 + M1, data = wideDF, n.iter = 100)
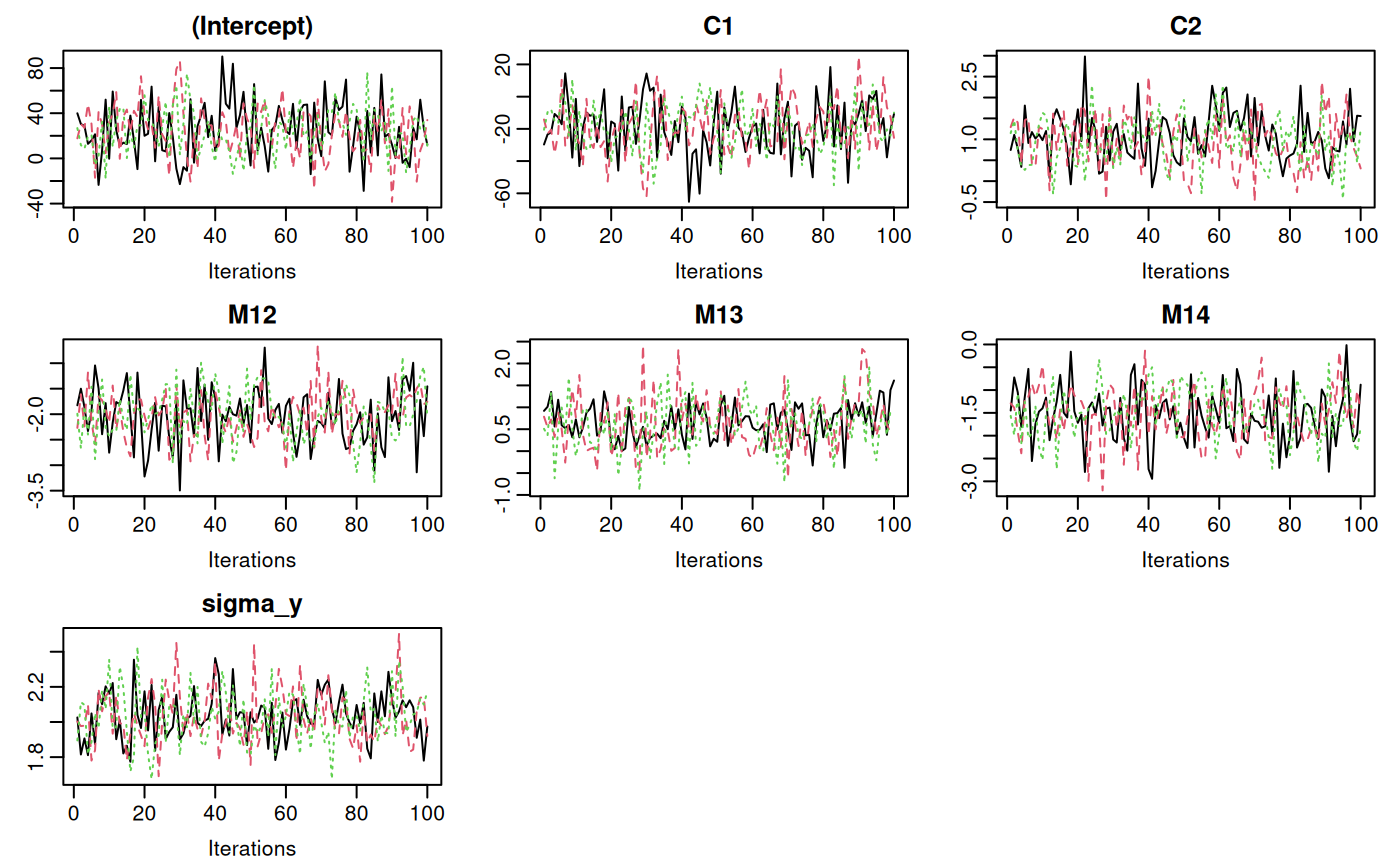
# Example 1: simple traceplot
traceplot(mod)
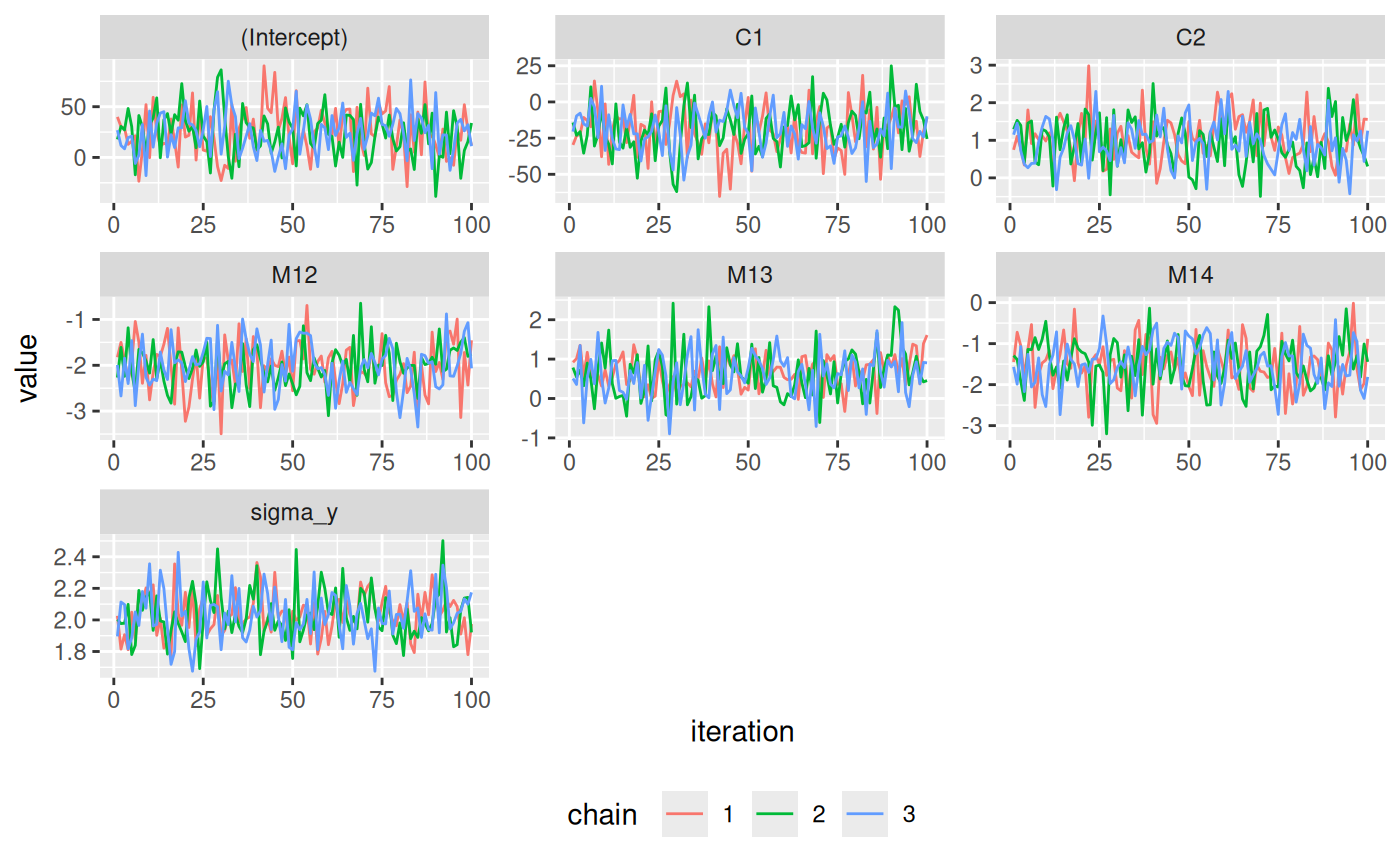
 # Example 2: ggplot version of traceplot
traceplot(mod, use_ggplot = TRUE)
# Example 2: ggplot version of traceplot
traceplot(mod, use_ggplot = TRUE)
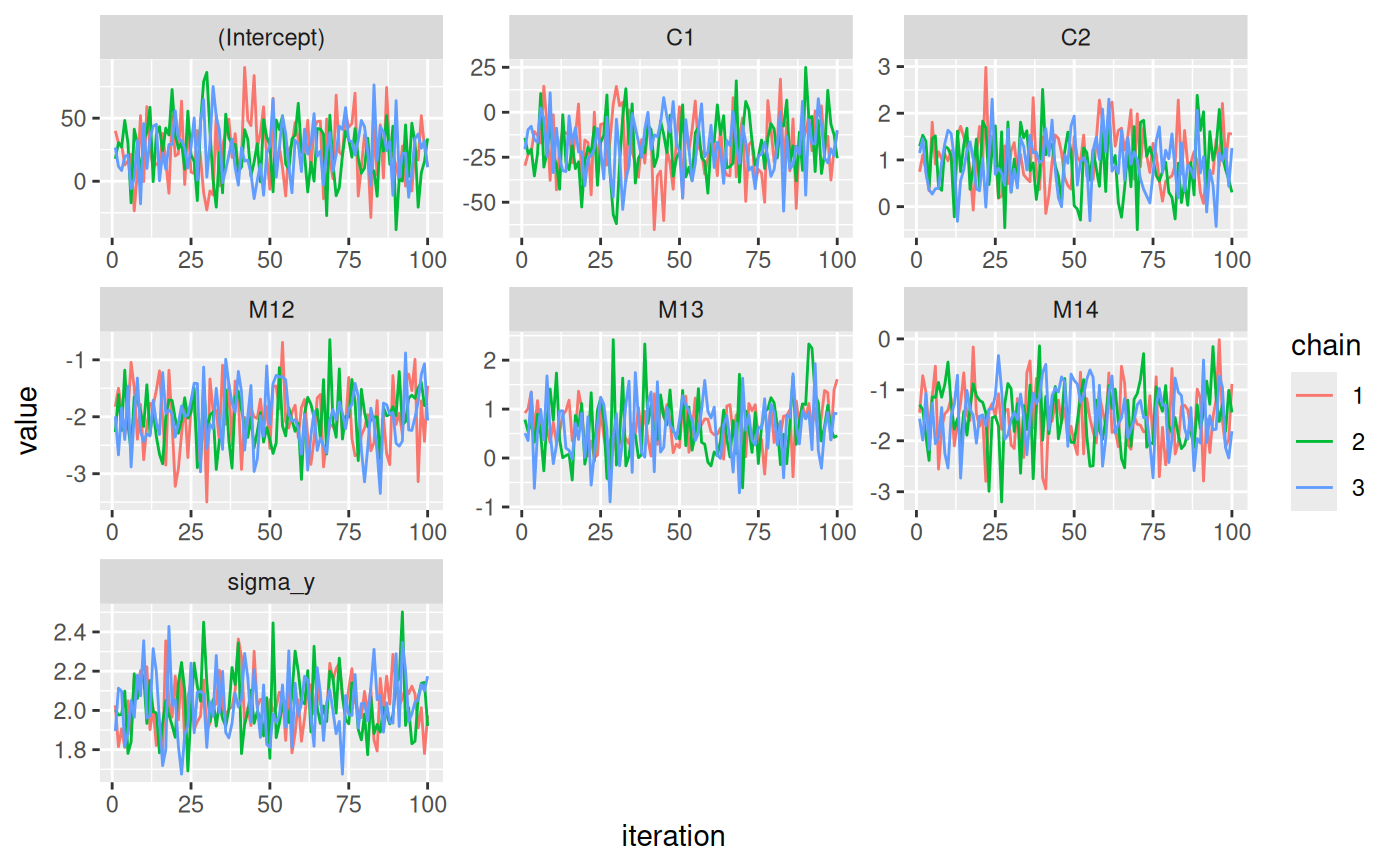 # Example 5: changing how the ggplot version looks (using ggplot syntax)
library(ggplot2)
traceplot(mod, use_ggplot = TRUE) +
theme(legend.position = 'bottom') +
xlab('iteration') +
ylab('value') +
scale_color_discrete(name = 'chain')
# Example 5: changing how the ggplot version looks (using ggplot syntax)
library(ggplot2)
traceplot(mod, use_ggplot = TRUE) +
theme(legend.position = 'bottom') +
xlab('iteration') +
ylab('value') +
scale_color_discrete(name = 'chain')