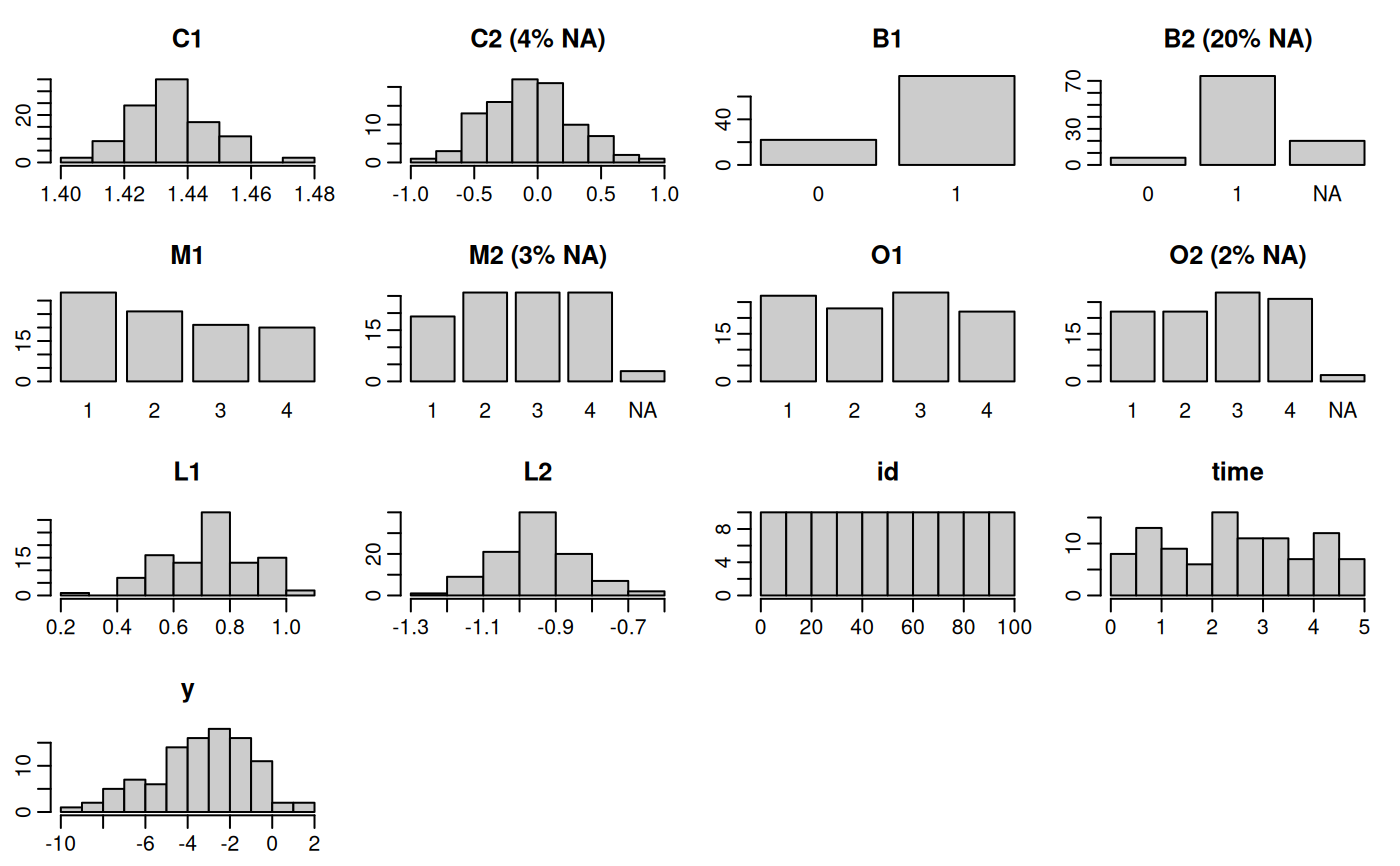
This function plots a grid of histograms (for continuous variables) and bar plots (for categorical variables) and labels it with the proportion of missing values in each variable.
Usage
plot_all(data, nrow = NULL, ncol = NULL, fill = grDevices::grey(0.8),
  border = "black", allNA = FALSE, idvars = NULL, xlab = "",
  ylab = "frequency", ...)
Arguments
- data
a
data.frame(or amatrix)- nrow
optional; number of rows in the plot layout; automatically chosen if unspecified
- ncol
optional; number of columns in the plot layout; automatically chosen if unspecified
- fill
colour the histograms and bars are filled with
- border
colour of the borders of the histograms and bars
- allNA
logical; if
FALSE(default) the proportion of missing values is only given for variables that have missing values, ifTRUEit is given for all variables- idvars
name of the column that specifies the multi-level grouping structure
- xlab, ylab
labels for the x- and y-axis
- ...
See also
Vignette: Visualizing Incomplete Data