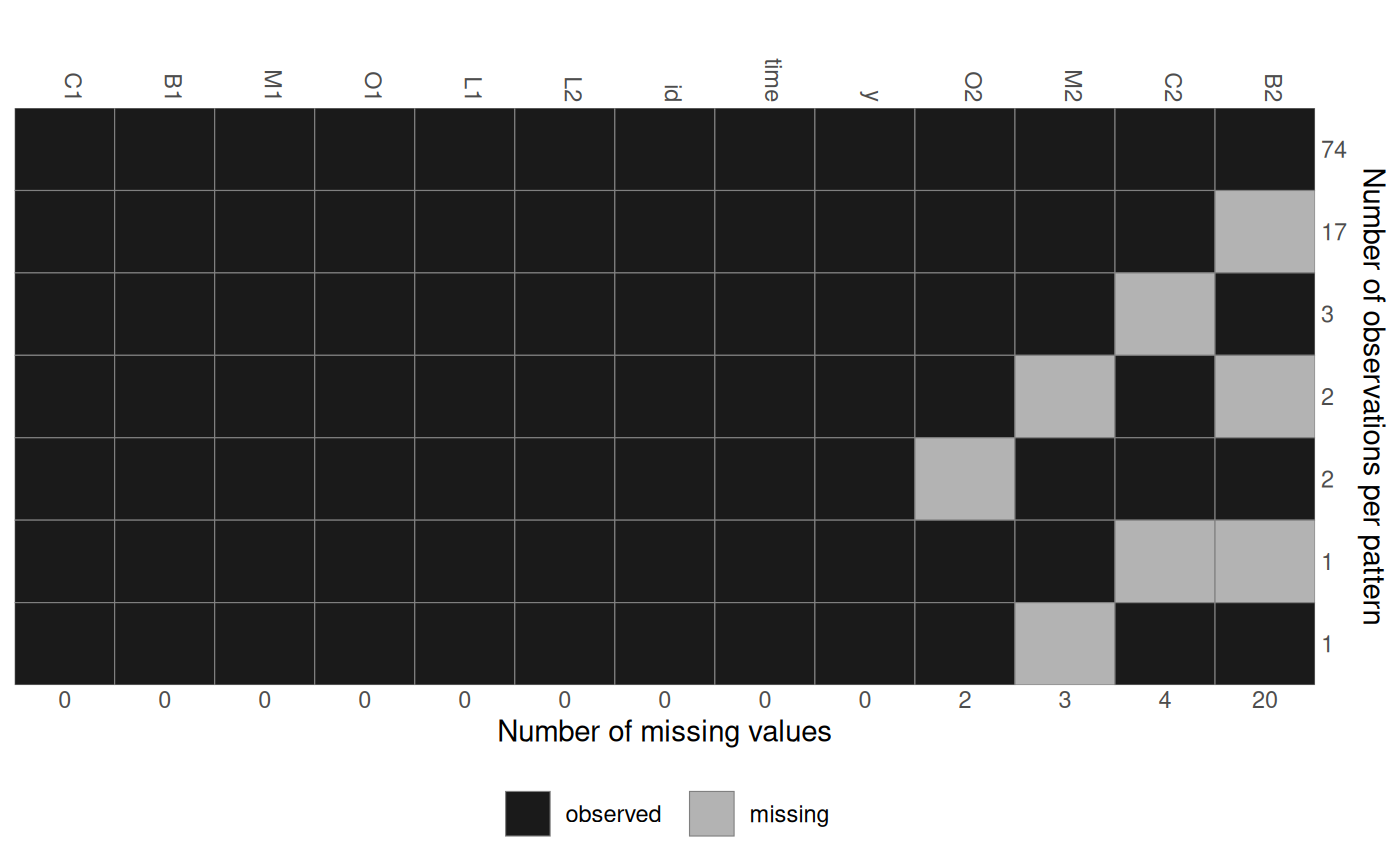
Obtain a plot of the pattern of missing data and/or return the pattern as a matrix.
Arguments
- data
data frame
- color
vector of length two, that specifies the colour used to indicate observed and missing values (in that order)
- border
colour of the grid
- plot
logical; should the missing data pattern be plotted? (default is
TRUE)- pattern
logical; should the missing data pattern be returned as matrix? (default is
FALSE)- print_xaxis, print_yaxis
logical; should the x-axis (below the plot) and y-axis (on the right) be printed?
- ylab
y-axis label
- legend.position
the default position of legends ("none", "left", "right", "bottom", "top", "inside")
- sort_columns
logical; should the columns be sorted by number of missing values? (default is
TRUE)- ...
optional additional parameters, currently not used
Note
This function requires the ggplot2 package to be installed.
See also
See the vignette Visualizing Incomplete Data for more examples.