These functions compute the cross-correlations of the MCMC samples in an
JointAI object via coda::crosscorr() and plot them using either the
corrplot package or coda::crosscorr.plot().
crosscorr(object, outcome = 1L, start = NULL, end = NULL, thin = NULL)

crosscorr_plot(object, outcome = 1L, start = NULL, end = NULL,
  thin = NULL, type = "corrplot")
Arguments
- object
an object of class JointAI
- outcome
integer; index of the outcome model for which the correlations should be plotted
- start
the first iteration of interest (see
window.mcmc)- end
the last iteration of interest (see
window.mcmc)- thin
thinning interval (integer; see
window.mcmc). For example,thin = 1(default) will keep the MCMC samples from all iterations;thin = 5would only keep every 5th iteration.- type
character; type of plot to be produced. Either "corrplot" (default) or "coda".
Value
a matrix (or a plot)
Examples
fit <- lm_imp(y ~ C1 + C2 + B2, data = wideDF, n.iter = 200)
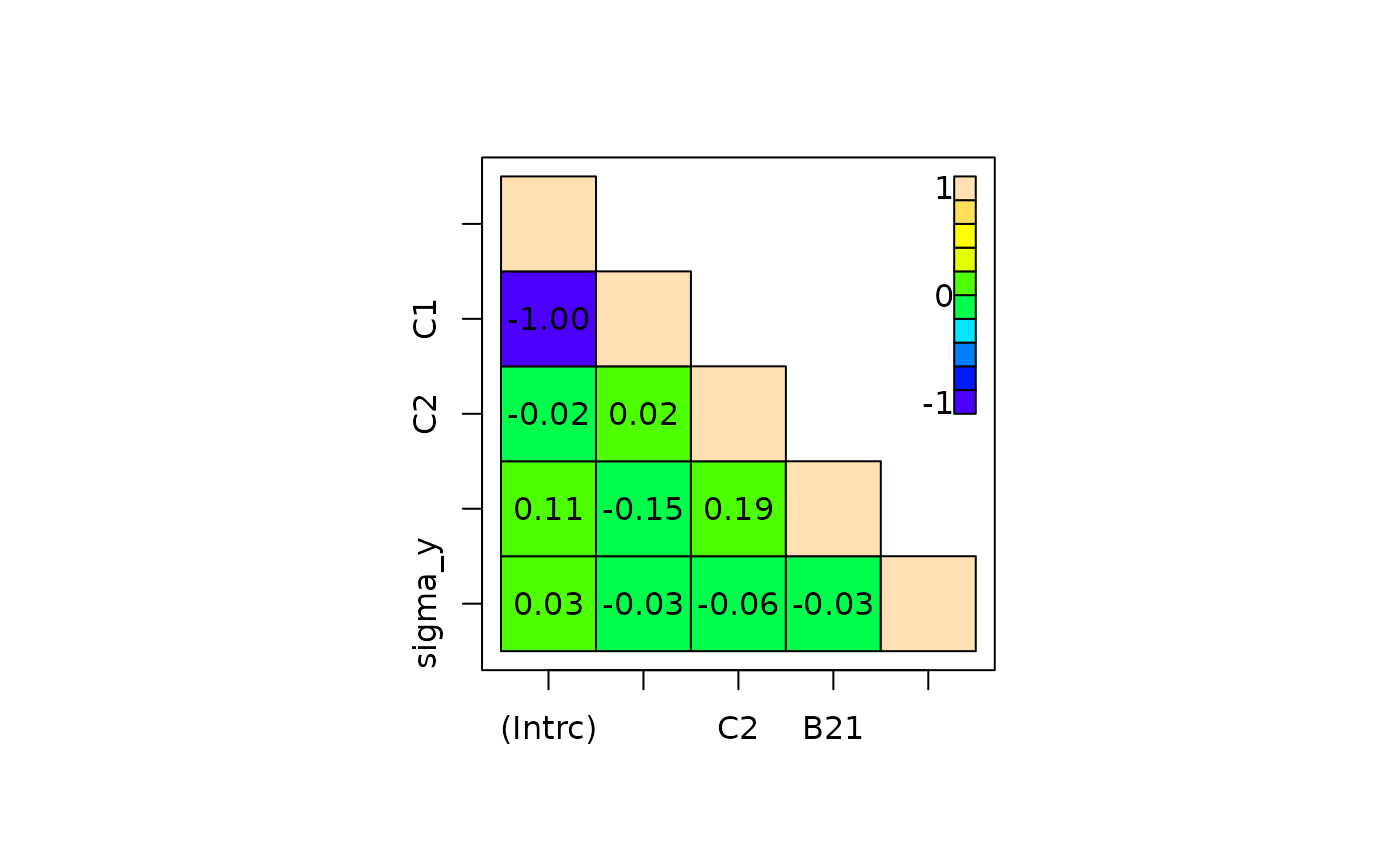
crosscorr(fit)
#> (Intercept) C1 C2 B21 sigma_y
#> (Intercept) 1.0000000 -0.99925413 -0.02073850 0.10941988 0.02898260
#> C1 -0.9992541 1.00000000 0.01577208 -0.14651159 -0.02785382
#> C2 -0.0207385 0.01577208 1.00000000 0.18532314 -0.05612436
#> B21 0.1094199 -0.14651159 0.18532314 1.00000000 -0.02838497
#> sigma_y 0.0289826 -0.02785382 -0.05612436 -0.02838497 1.00000000
crosscorr_plot(fit, type = "coda")