These functions compute the cross-correlations of the MCMC samples in an
JointAI object via coda::crosscorr() and plot them using either the
corrplot package or coda::crosscorr.plot().
Usage
cross_corr(object, outcome = 1L, start = NULL, end = NULL, thin = NULL)

cross_corr_plot(object, outcome = 1L, start = NULL, end = NULL,
  thin = NULL, type = "corrplot")
Arguments
- object
an object of class JointAI
- outcome
integer; index of the outcome model for which the correlations should be plotted
- start
the first iteration of interest (see
window.mcmc)- end
the last iteration of interest (see
window.mcmc)- thin
thinning interval (integer; see
window.mcmc). For example,thin = 1(default) will keep the MCMC samples from all iterations;thin = 5would only keep every 5th iteration.- type
character; type of plot to be produced. Either "corrplot" (default) or "coda".
Examples
fit <- lm_imp(y ~ C1 + C2 + B2, data = wideDF, n.iter = 200)
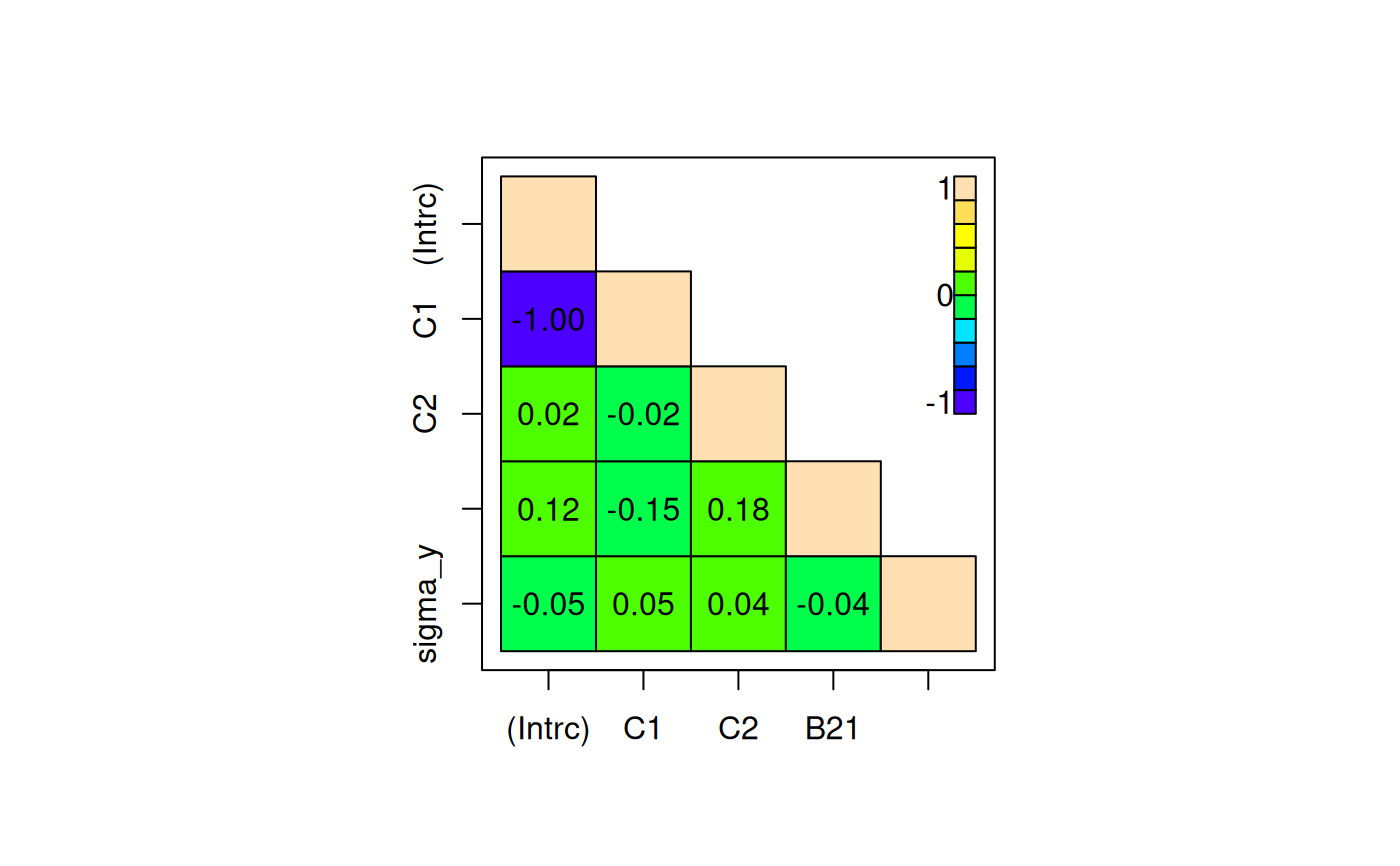
cross_corr(fit)
#> (Intercept) C1 C2 B21 sigma_y
#> (Intercept) 1.00000000 -0.99932344 0.01671787 0.11588899 -0.04553272
#> C1 -0.99932344 1.00000000 -0.02108018 -0.15109733 0.04676991
#> C2 0.01671787 -0.02108018 1.00000000 0.17958905 0.03570433
#> B21 0.11588899 -0.15109733 0.17958905 1.00000000 -0.03596415
#> sigma_y -0.04553272 0.04676991 0.03570433 -0.03596415 1.00000000
cross_corr_plot(fit, type = "coda")